Dec 5, 2025
What is Net Promoter Score (NPS) and How to Use It
For a bank in Mumbai, it might be a customer deciding whether to renew their credit card. For an e-commerce giant in Bangalore, it’s a shopper debating if they’ll order again after a delayed delivery. For a SaaS company, it’s a client choosing whether to extend their subscription.
In every case, one question hangs in the balance: “Would this customer recommend us to someone else?”
Instead of guessing how loyal your customers really are, Net Promoter Score (NPS) gives you a clear, quantifiable answer. By asking just a single question, businesses gain insights not only into satisfaction, but into advocacy, risk of churn, and potential revenue impact.
In this blog, we’ll break down what NPS is, how NPS scores are calculated, why they matter, and how companies can use them to strengthen customer relationships and business outcomes.
At a glance:
NPS measures customer loyalty. It asks how likely customers are to recommend a brand, classifying them as Promoters, Passives, or Detractors, with scores ranging from -100 to +100.
High NPS predicts business growth. It highlights potential referrals, retention, and revenue impact while helping identify brand advocates and at-risk customers for targeted actions.
Benchmarks vary by industry. Scores like BFSI ~60, Healthcare ~62, Education ~60, Retail ~57, and SaaS ~44 show that context is key to interpreting your NPS.
Effective programs focus on timing and action. Use transactional, relationship, and employee surveys; keep them short, send at the right touchpoints, and close the feedback loop to improve experiences.
CubeRoot enhances NPS through automation. Its multilingual Voice AI platform manages high-volume customer interactions across BFSI, Retail, SaaS, D2C, Edtech, and Healthcare, improving efficiency, compliance, and customer experience.
What is the Net Promoter Score (NPS)?
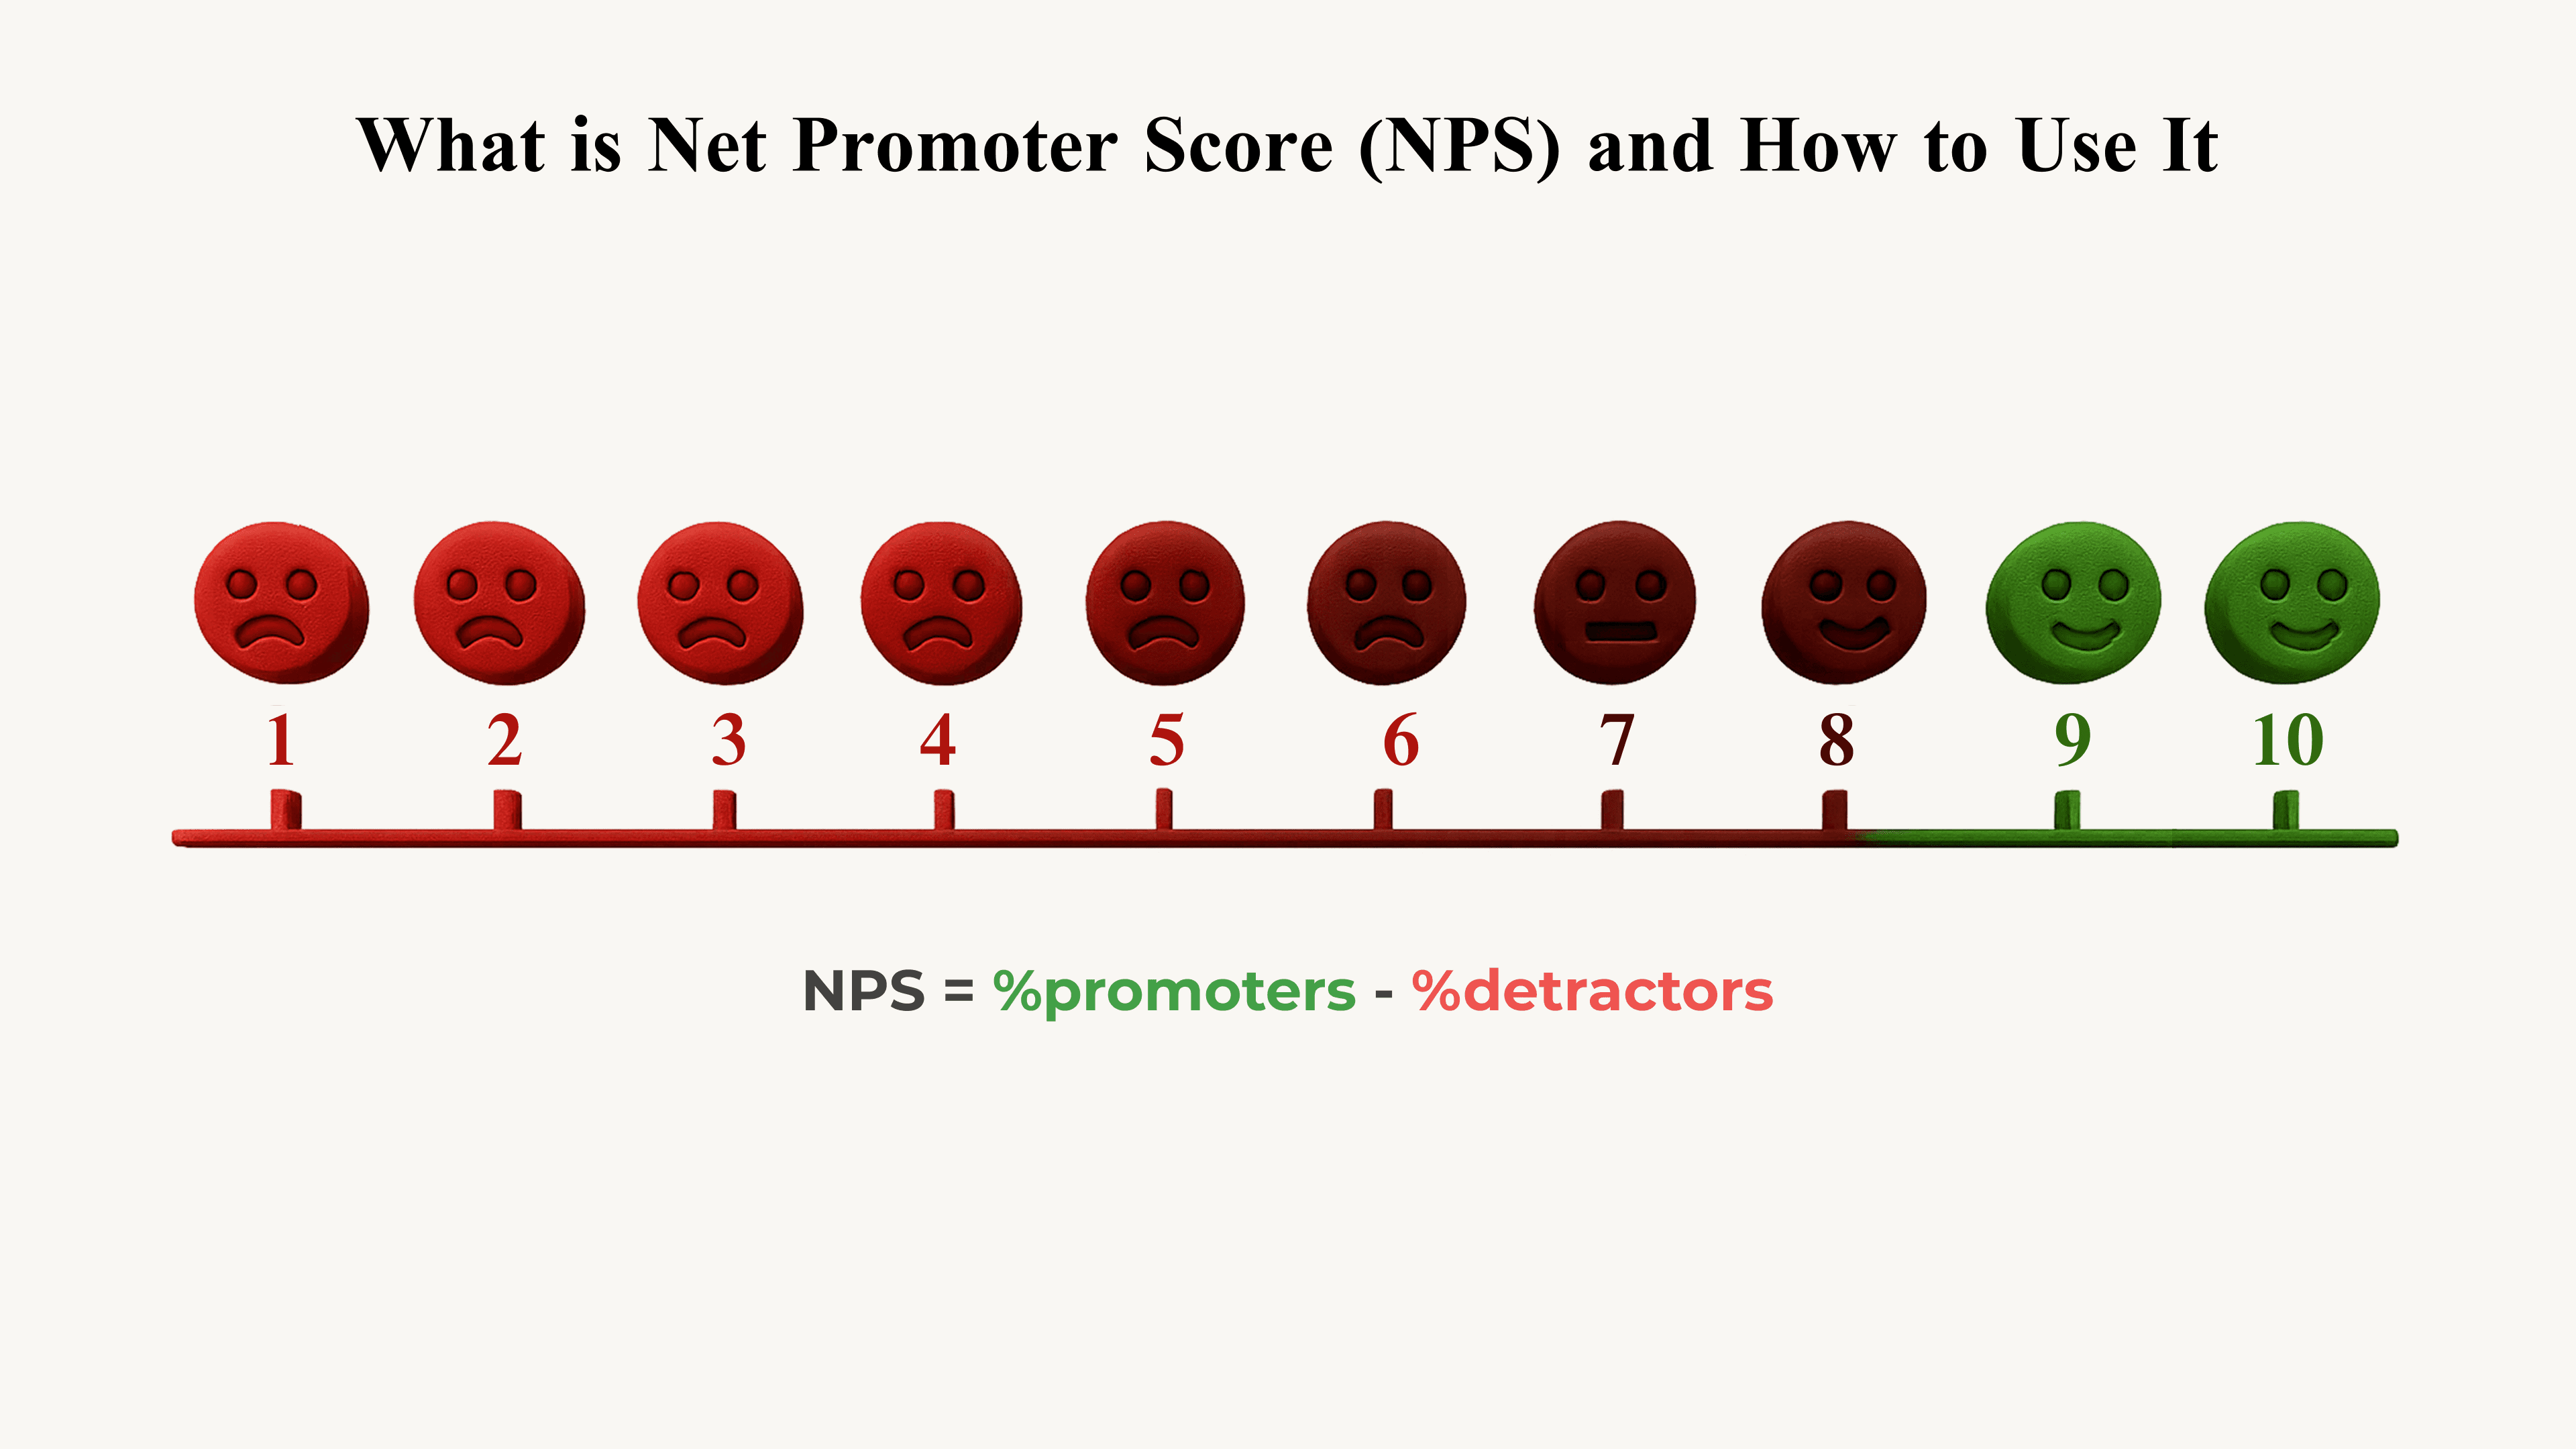
Net Promoter Score, or NPS, is a widely used metric that quantifies customer loyalty and advocacy. Instead of tracking multiple indicators of satisfaction, NPS condenses customer sentiment into a single score that shows how enthusiastic customers are about your brand.
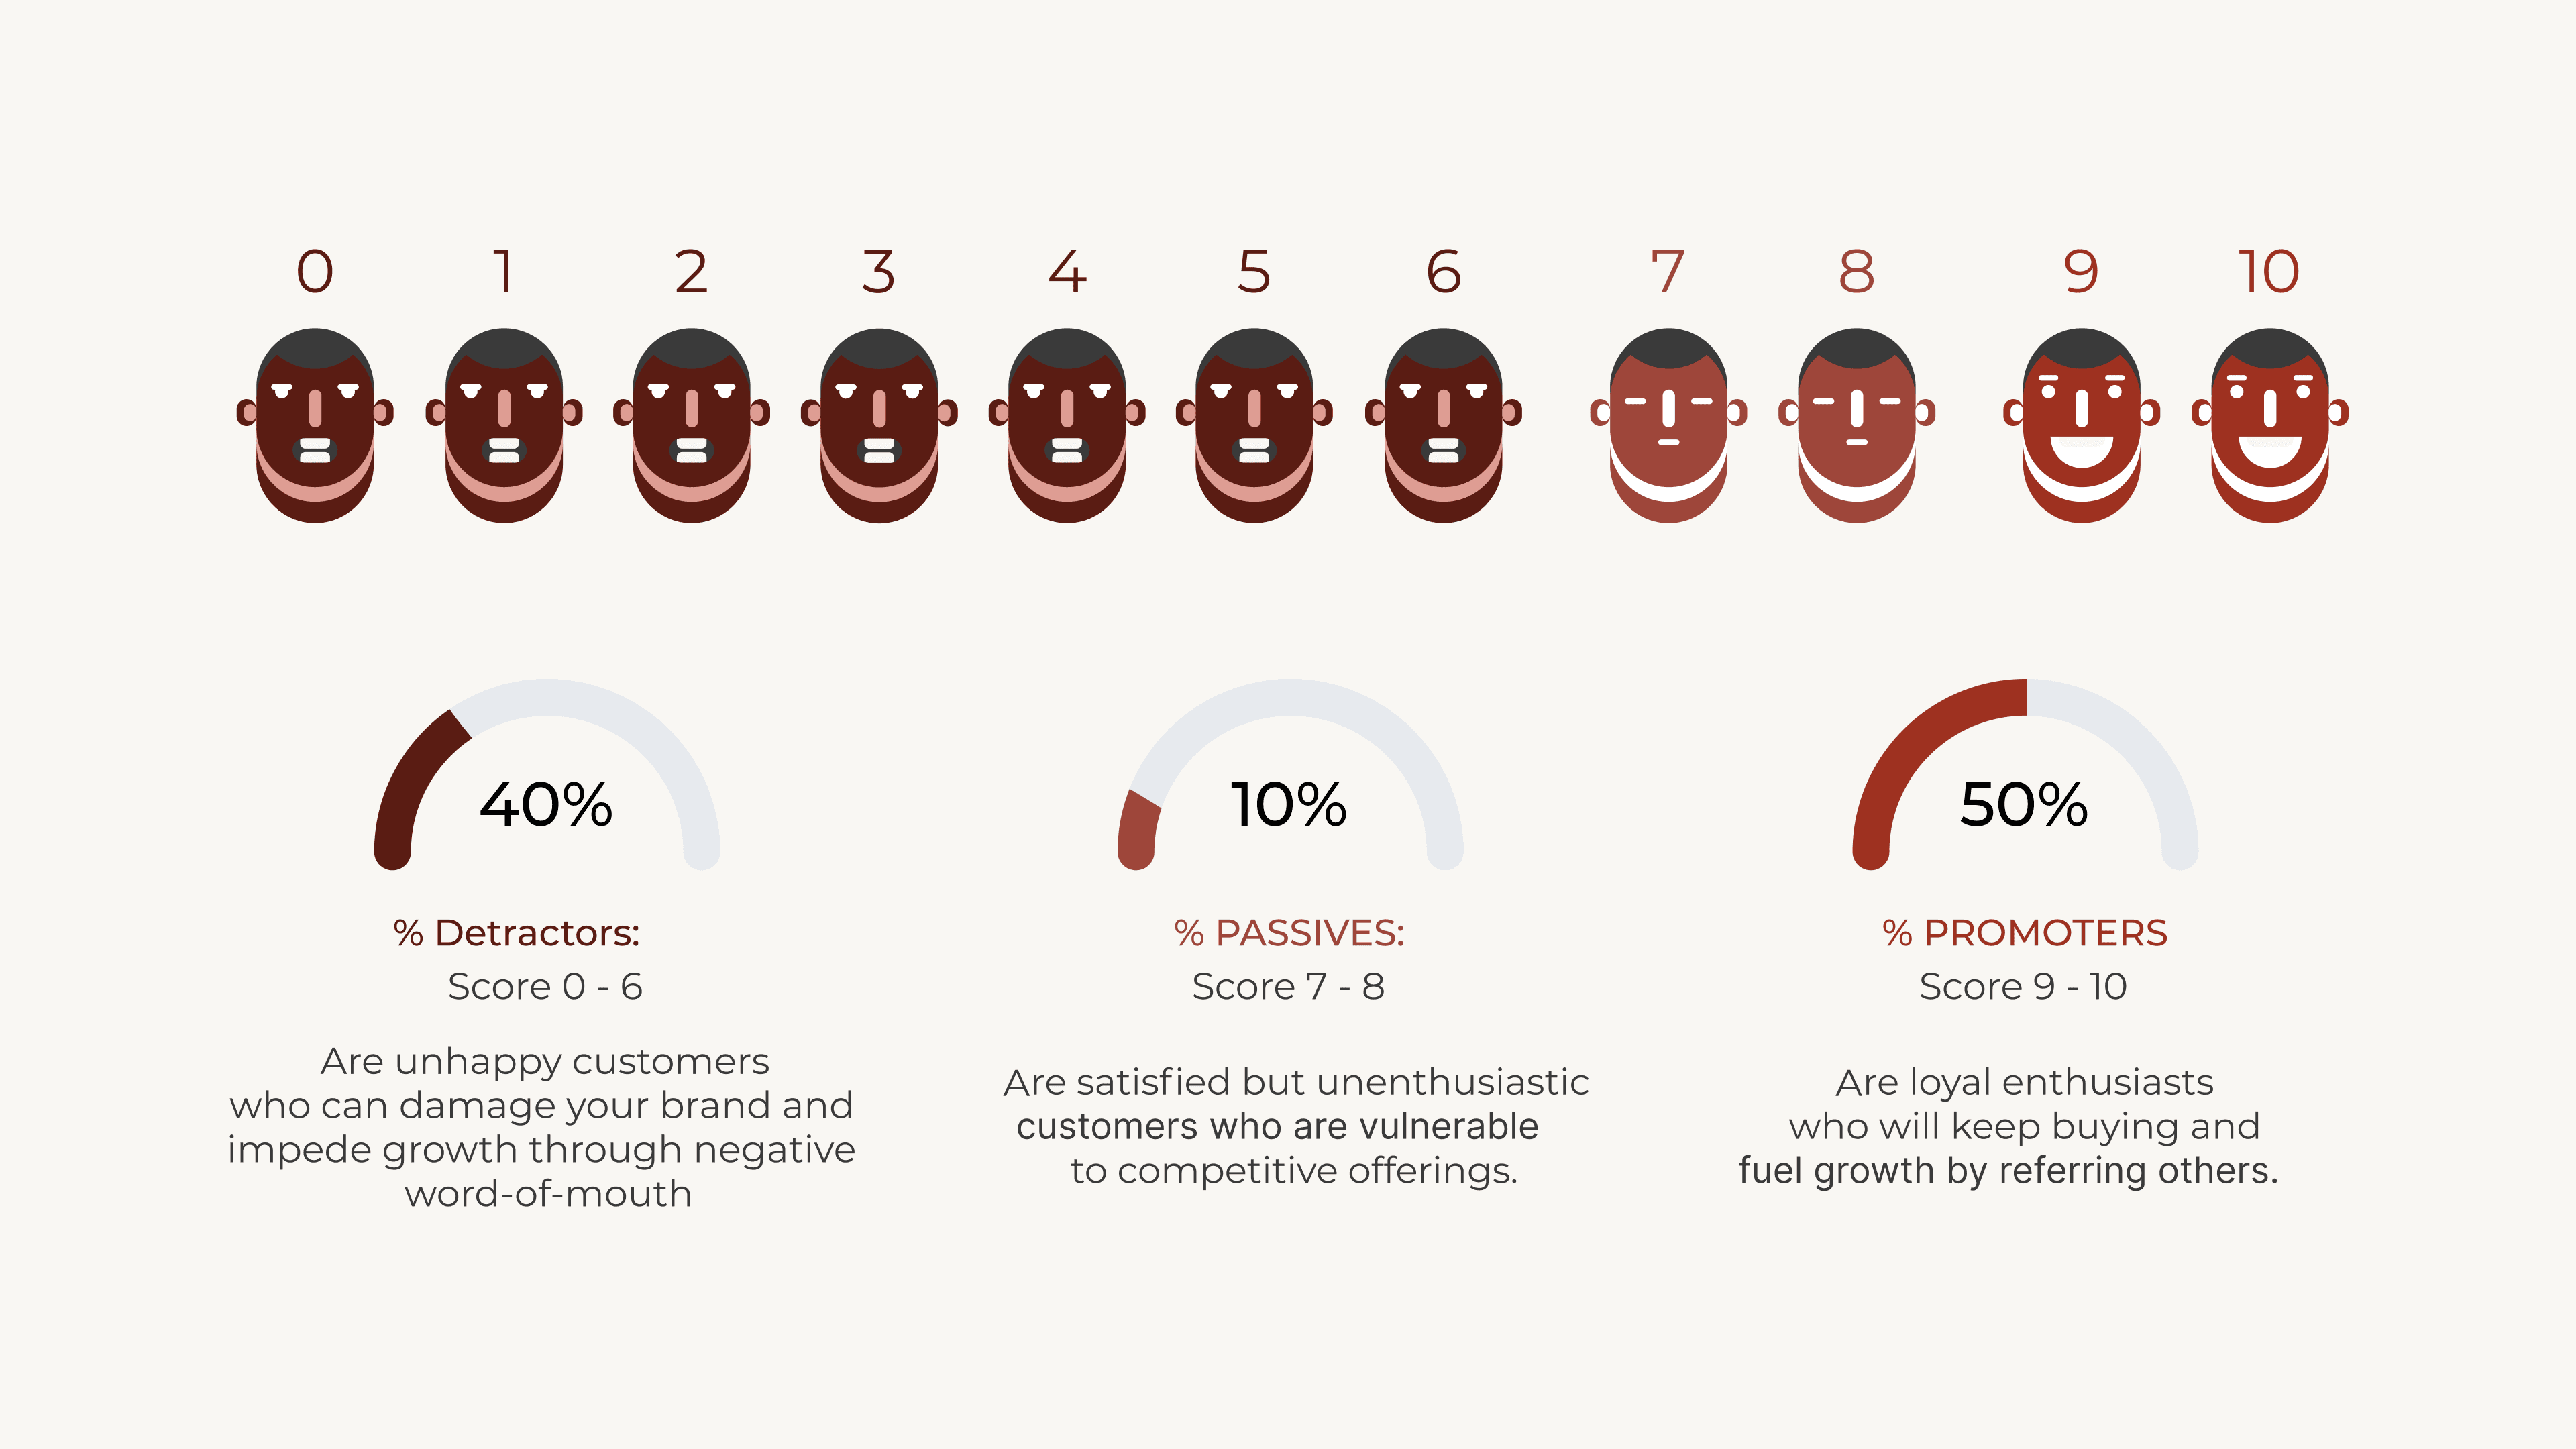
Respondents rate their experience on a scale from 0 to 10, which allows companies to classify them into three groups:
Promoters (9–10): Loyal customers
Passives (7–8): Satisfied customers
Detractors (0–6): Unhappy customers
The NPS score is calculated by subtracting the percentage of Detractors from the percentage of Promoters, resulting in a number ranging from -100 to +100. A higher score indicates stronger customer loyalty and greater potential for advocacy.
For Indian enterprises, across BFSI, e-commerce, or SaaS sectors, NPS is more than a metric. It provides actionable insights into customer trust, satisfaction, and potential revenue impact. Tracking NPS over time helps businesses identify friction points, optimize experiences, and measure the effect of initiatives such as new product launches or service improvements.
How to Calculate Net Promoter Score
The strength of NPS lies in its simplicity. Unlike complex customer satisfaction models, it uses a single calculation to deliver a clear picture of loyalty. Here’s how it works:
1. Collect Responses
Customers are asked a single question: “On a scale of 0 to 10, how likely are you to recommend us to a friend or colleague?”
2. Group Customers
Based on their score, respondents are classified into three categories:
Promoters (9–10): Highly satisfied customers who are enthusiastic about your brand. They are most likely to make repeat purchases, renew contracts, and actively recommend your business to others.
Passives (7–8): Customers who are somewhat satisfied but not enthusiastic. They may stay loyal if nothing better comes along, but they are also vulnerable to switching if competitors offer more value.
Detractors (0–6): Unhappy customers who are at risk of churn. They may also share negative experiences, which can harm your reputation.
3. Apply the Formula
NPS = % Promoters − % Detractors |
The result is a score that can range from -100 (if every customer is a detractor) to +100 (if every customer is a promoter).
4. Interpret the Score
Below 0: More detractors than promoters. Signals customer dissatisfaction and high churn risk.
0 to +30: A decent score, but with room for improvement.
+30 to +50: Strong performance and customer loyalty.
Above +50: Excellent score, reflecting a highly loyal customer base.
Example:
60% of respondents are Promoters
20% are Passives
20% are Detractors
NPS = 60 – 20 = +40
A score above zero indicates more promoters than detractors, while scores above +50 are typically seen as excellent.
5. Connect to Business Impact
For large enterprises, this calculation acts as a proxy for future growth. A higher NPS usually correlates with stronger customer retention, positive word-of-mouth, and higher lifetime value.
Conversely, a low or declining NPS can be an early warning of churn or reputational risk.
What Is a Good NPS? Benchmarking Your Score
An NPS on its own doesn’t tell the full story. What’s considered “good” or “bad” depends heavily on your industry and customer expectations. Benchmarks provide context and help you see how you compare with peers.
According to SurveyMonkey’s benchmark data (based on 150,000+ organizations):
The average NPS across industries is 32
The median score is 44
The top 25% achieve 72 or higher
To put these numbers in perspective, here’s how NPS typically looks across different industries:
Industry | Median NPS | What It Means |
Finance / Financial Services | 59–60 | Customers show relatively high loyalty and trust |
Healthcare | 62 | Patient satisfaction and trust are strong |
Education / EdTech | 60 | High scores reflect strong satisfaction when outcomes are met |
Retail | 57 | Competitive, but customers can switch easily |
Insurance | 65 | Strong trust factor, but sensitive to claim experiences |
Software & Online Services (SaaS) | 44 | Moderate — plenty of room to differentiate |
Technology | 50 | Above average, shows strong product adoption |
Media & Entertainment | 57 | Content-driven; audiences are fickle, competition is high |
Consulting | 48 | Loyalty depends on expertise and client relationships |
Transportation & Logistics | 44 | Lower scores are common due to operational issues |
In sectors like BFSI and healthcare, an NPS below 50 is a red flag, while in SaaS or logistics, even scores in the mid-40s can be considered competitive.
Also read: How Conversational Customer Service Enhances Business Success
Why NPS Matters for Business Growth
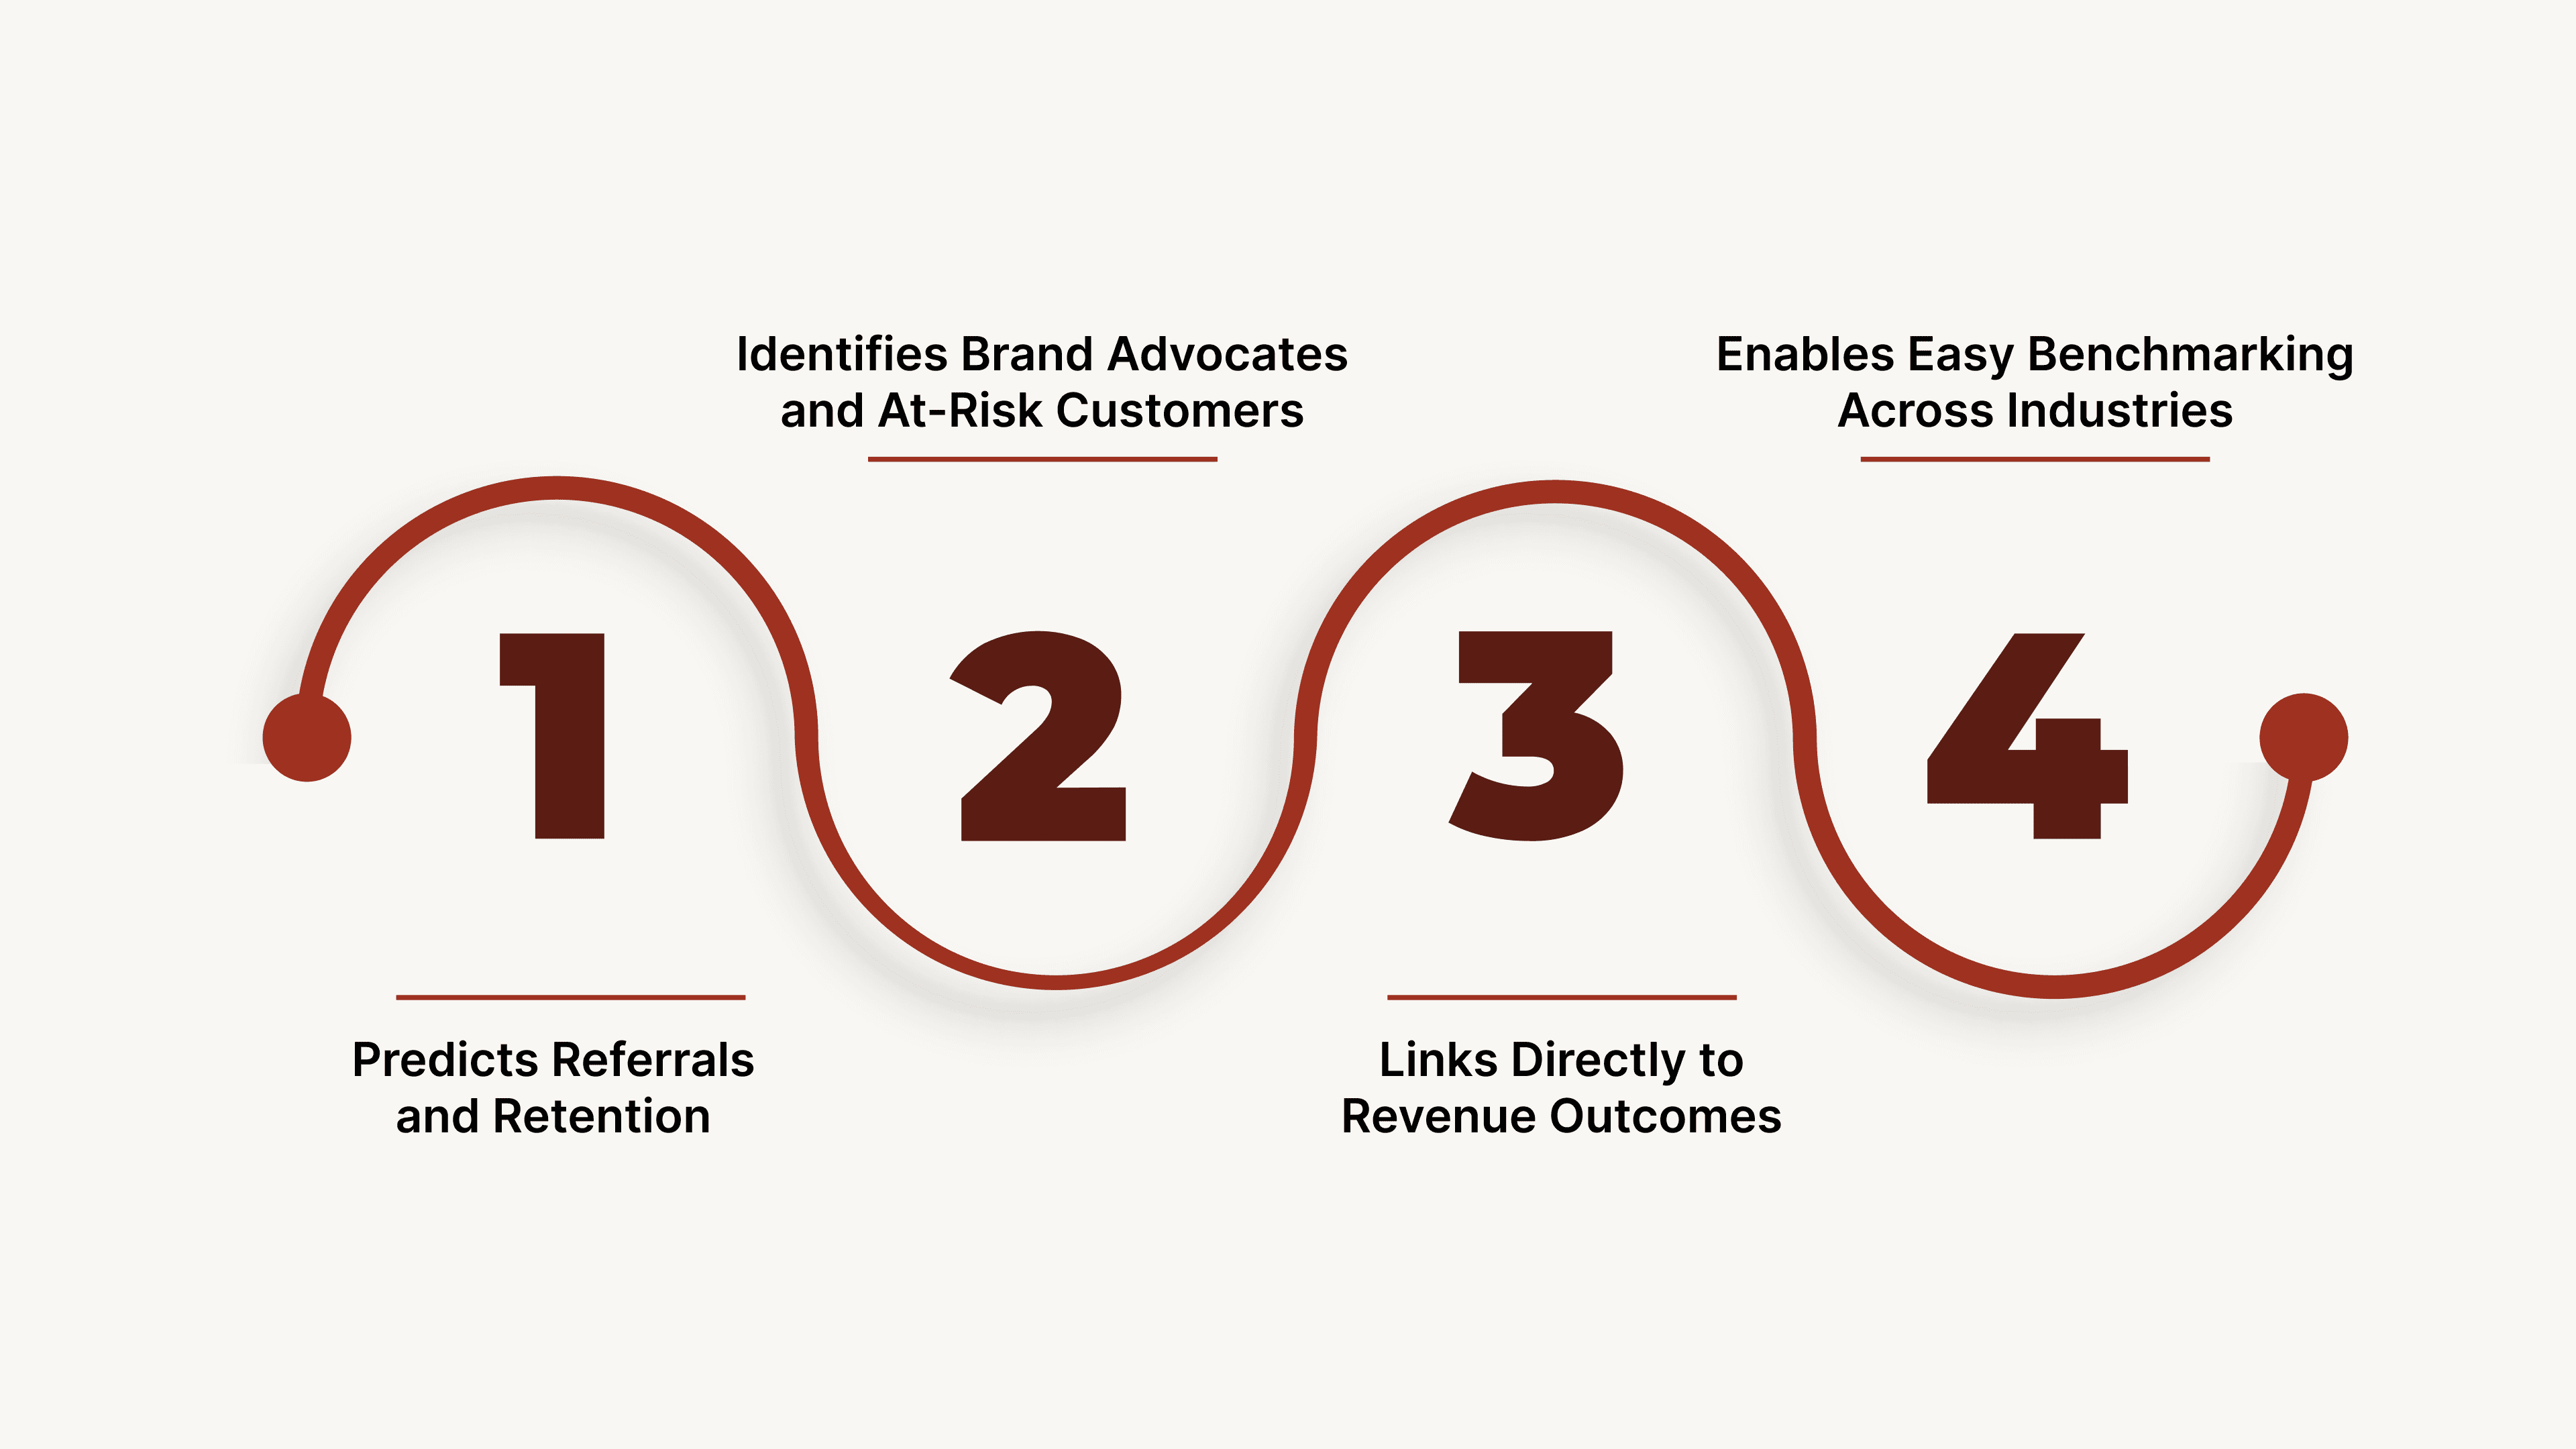
Net Promoter Score is a predictor of long-term business performance. By focusing on how likely customers are to recommend your brand, NPS highlights both risks and opportunities that directly impact growth.
1. Predicts Referrals and Retention
A high NPS signals that customers are not just satisfied but willing to recommend you. This translates into organic growth through word-of-mouth referrals and stronger customer retention. In BFSI, satisfied customers are more likely to renew loans or credit cards. In SaaS, promoters tend to renew subscriptions year after year.
2. Identifies Brand Advocates and At-Risk Customers
By splitting customers into promoters, passives, and detractors, NPS helps companies identify their strongest advocates and those most likely to churn. This segmentation allows teams to invest in loyalty programs for promoters while proactively addressing issues faced by detractors.
3. Links Directly to Revenue Outcomes
NPS has a clear connection to revenue performance. In e-commerce, promoters drive repeat purchases during seasonal sales. In SaaS, reducing detractors directly lowers churn. In BFSI, positive customer experiences improve renewal rates for accounts and policies.
4. Enables Easy Benchmarking Across Industries
Because NPS is standardized, it offers a straightforward way to benchmark performance against competitors. A bank, retailer, or SaaS provider can all measure loyalty on the same scale, making it easier to spot gaps and track progress over time.
When measured and acted on consistently, NPS can help companies improve customer lifetime value, reduce churn, and expand faster through advocacy-driven growth.
Types of NPS Surveys
While the Net Promoter Score is built on a single core question, the way you deliver the survey and the context in which you use it can differ.
Organizations typically use three main types of NPS surveys:
1. Transactional NPS (tNPS)
Transactional NPS surveys are sent immediately after a specific customer interaction. This could be completing an online purchase, contacting support, or finishing an onboarding flow. The goal is to capture feedback tied to a single experience so you can identify process-level improvements.
For example, a retail platform might ask customers about their likelihood to recommend after a return is processed.
2. Relationship NPS (rNPS)
Relationship NPS surveys are conducted periodically, such as quarterly or annually, to assess the overall strength of the customer relationship.
This survey helps you understand long-term loyalty and satisfaction with your brand as a whole, rather than a single touchpoint. BFSI companies often run relationship surveys to measure ongoing trust and service satisfaction across their client base.
3. Employee NPS (eNPS)
Employee NPS applies the same methodology internally. Instead of customers, it measures how likely employees are to recommend their workplace to others.
A high eNPS indicates engaged, motivated teams, while a low score highlights cultural or operational issues that can affect retention and productivity. Many enterprises use eNPS as part of their HR or people analytics programs.
Together, these three survey types provide a 360-degree view of loyalty and advocacy.
How to Run an Effective NPS Program
Collecting Net Promoter Scores is only the first step. To see real business impact, companies need to design their NPS program thoughtfully, distribute surveys at the right time, and act on the insights.
Here are the essentials:
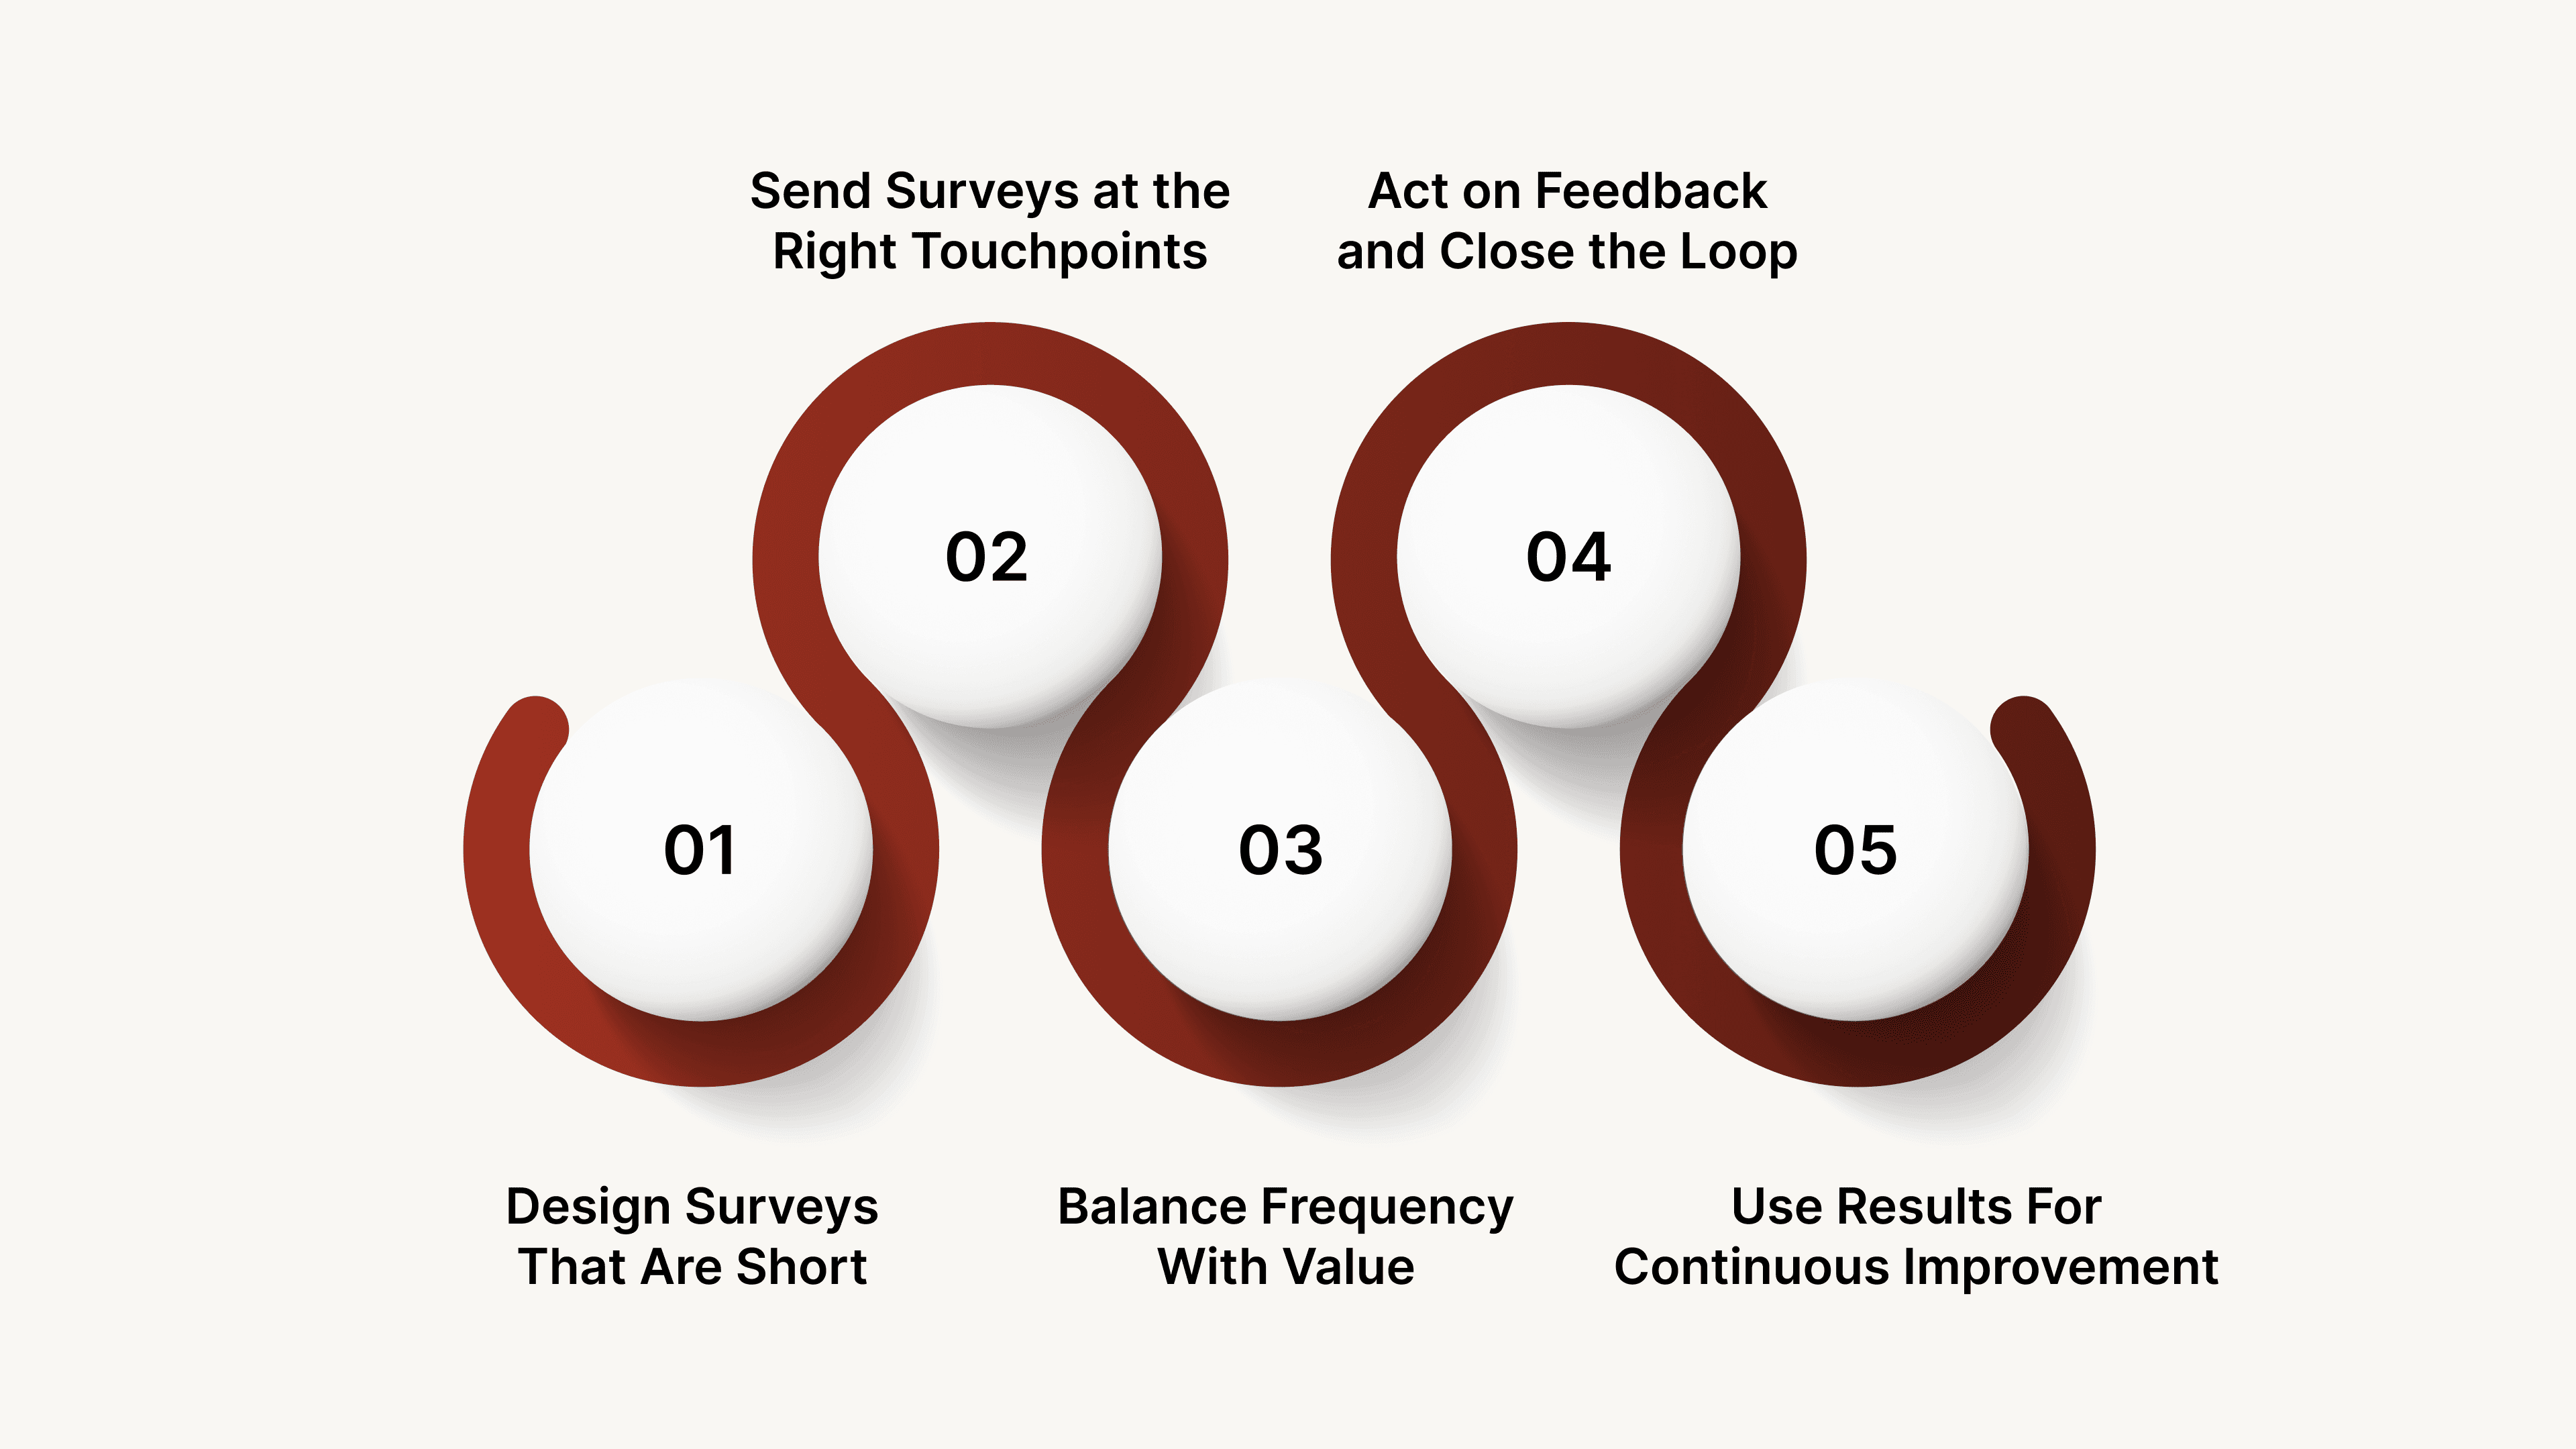
1. Design Surveys That Are Short and Frictionless
Keep the core NPS question front and center: “How likely are you to recommend us to a friend or colleague?” Add a simple follow-up, such as “What is the main reason for your score?” to capture context. Avoid long forms that reduce response rates.
2. Send Surveys at the Right Touchpoints
Timing is critical. For BFSI, this could be after loan closure or payment processing. For retail and eCommerce, post-checkout or after a return is resolved. In healthcare, after a patient follow-up. Well-placed surveys capture feedback when the experience is still fresh.
3. Balance Frequency With Value
Transactional NPS surveys can be sent immediately after key interactions, while relationship NPS surveys should be scheduled quarterly or biannually. Over-surveying leads to fatigue and lower participation.
4. Act on Feedback and Close the Loop
The biggest mistake organizations make is treating NPS as a reporting metric. Acknowledge responses, prioritize themes, and take visible action. If detractors raise issues, respond quickly to address them. For promoters, strengthen relationships through loyalty or referral programs. Most importantly, communicate changes back to customers so they know their feedback made a difference.
5. Use Results to Drive Continuous Improvement
Over time, track trends by segment, geography, or product line. Combine NPS insights with other business KPIs such as churn, repeat orders, or account renewals. This ensures NPS isn’t just a survey score but a tool for long-term growth.
When done right, an NPS program becomes a closed feedback loop that improves experiences, strengthens loyalty, and accelerates customer advocacy.
Challenges with NPS Collection
While NPS is simple in theory, many organizations struggle to capture accurate and actionable insights. Some of the most common challenges include:
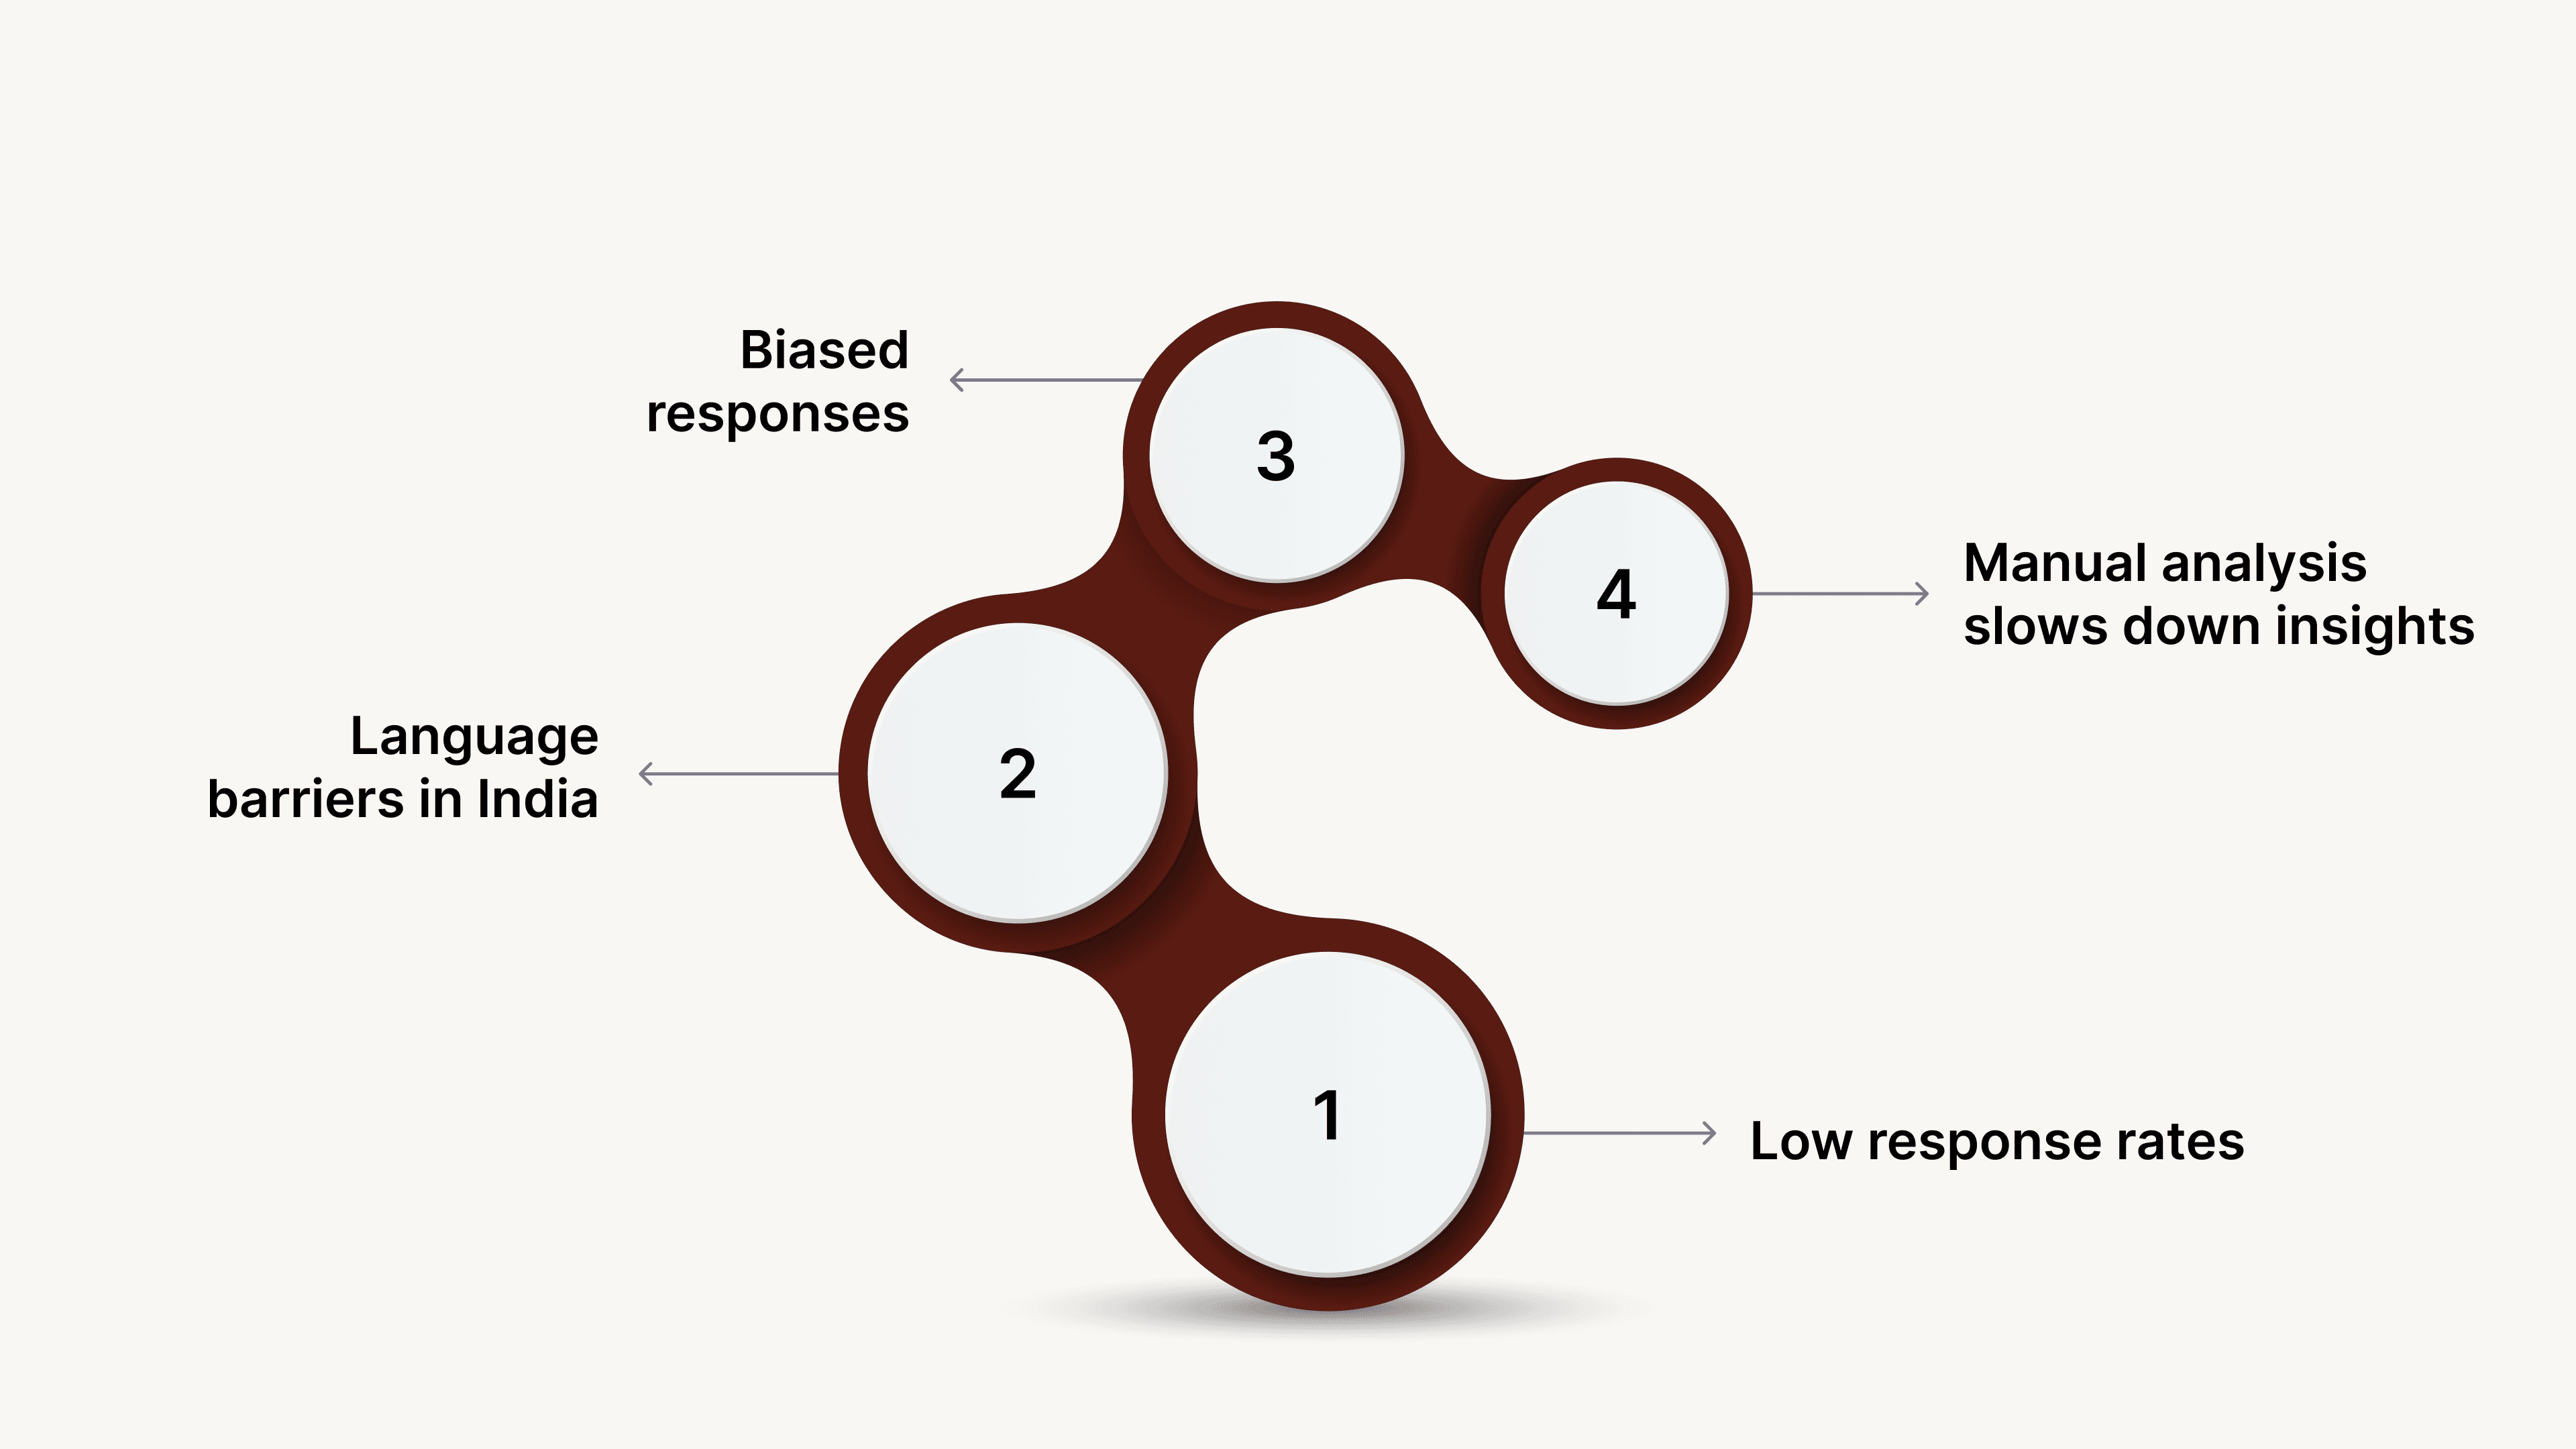
Low response rates: Customers often ignore survey links sent via email or SMS. Without strong participation, scores may not reflect the broader customer base. Enterprises need to think creatively about distribution, such as in-app prompts, IVR voice surveys, or WhatsApp outreach.
Language barriers in India: With such a diverse, multilingual population, English-only surveys limit reach. A bank in Delhi might serve both Hindi and Punjabi speakers, while an eCommerce platform in the South may need Tamil or Telugu. Surveys that are not localized often miss valuable feedback.
Biased responses: NPS surveys tend to attract customers with extreme opinions — those who are very satisfied or very frustrated. As a result, the middle group of “silent passives” often goes unheard, which can skew the results and mask areas for improvement.
Manual analysis slows down insights: Collecting NPS at scale generates thousands of comments and scores. Without automation, teams spend weeks tagging and interpreting responses. This delay reduces the ability to act quickly on detractor feedback or capitalize on promoter advocacy.
Overcoming these challenges requires thoughtful survey design, multilingual delivery, and technology-driven analysis to ensure the insights are representative, timely, and actionable.
Also read: Conversational AI for Finance: Transforming Financial Services
How CubeRoot Helps Improve NPS Scores
CubeRoot is an enterprise-grade Voice AI platform designed to scale high-volume customer interactions across BFSI, Retail/eCommerce, SaaS, D2C, Edtech, and Healthcare. Its multilingual, conversational AI voice agents handle both inbound and outbound interactions, delivering human-like experiences while automating repetitive tasks and maintaining quality and compliance.
To boost customer loyalty and improve NPS scores, CubeRoot offers features that focus on speed, scalability, and sector-specific needs:
Key Features of CubeRoot
Voice AI Agents: Automates customer interactions like balance inquiries, order tracking, appointment booking, and lead qualification.
Outbound & Collections Automation: Handles pre- and post-due payment reminders for BFSI, ensuring compliance while improving recovery rates.
Order & Returns Automation: Manages high-volume eCommerce queries, returns, and delivery feedback without increasing headcount.
Lead Qualification & Sales Funnel Automation: Boosts conversions with eligibility checks, intent routing, and hot lead escalation.
Voice Feedback & Post-Sale Experience: Captures CSAT and NPS feedback efficiently and pre-triages complaints for faster resolution.
Prebuilt, Industry-Specific Workflows: Ready-to-use templates for BFSI, Retail, SaaS, D2C, Edtech, and Healthcare for rapid deployment.
Human-in-the-Loop Escalation: Complex cases are handed over to live agents seamlessly without breaking the customer experience.
Multilingual, 24/7 Availability: Supports multiple Indian languages and English to reach a diverse customer base.
By using these capabilities, CubeRoot enables enterprises to deliver consistent, personalized, and scalable customer experiences, directly driving higher NPS scores and stronger customer loyalty. Request a demo today to see how CubeRoot can transform your customer interactions.
FAQs
1. What is a good NPS score?
A good NPS depends on industry benchmarks. Generally, above 0 is good, 30–50 is strong, 50–70 is excellent, and 70+ is world-class. Comparing with competitors helps understand where your brand stands in loyalty and satisfaction.
2. Is NPS from 0 to 10 or 1 to 10?
NPS surveys typically use a 0–10 scale. Zero means “not at all likely” to recommend, and ten is “extremely likely.” This scale allows differentiation between detractors, passives, and promoters, giving a clear picture of customer loyalty.
3. How is an NPS score calculated?
NPS is calculated by subtracting the percentage of detractors (0–6) from promoters (9–10). Passives (7–8) do not count in the calculation. The score ranges from -100 to 100, reflecting overall customer satisfaction and loyalty.
4. What is the NPS score 0 to 5?
An NPS on a 0–5 scale can be adapted by mapping 0–2 as detractors, 3 as passive, and 4–5 as promoters. Scores are then calculated using the same formula: %Promoters minus %Detractors, scaled appropriately for comparison.
5. What does a negative NPS score mean?
A negative NPS means you have more detractors than promoters, indicating dissatisfaction. This suggests customers may share negative experiences, increasing churn risk. Identifying and addressing pain points is critical to improve loyalty and prevent reputational damage.
6. How often should I measure NPS?
Frequency depends on business needs. Many companies survey quarterly, annually, or after major touchpoints like purchases, onboarding, or service interactions. Regular measurement helps track trends, respond to issues quickly, and evaluate the impact of improvements.


